
Business Intelligence Dashboard
Executive users have a collective snapshot of current business performance and key areas of focus. Focus points include:
- FAB5 Summary
- Annual Revenue
- Annual Revenue by Team
- Meetings - My To Do List
- My Tasks
- Upcoming Meetings
- My Delegation Progress
- My Improvement Progress
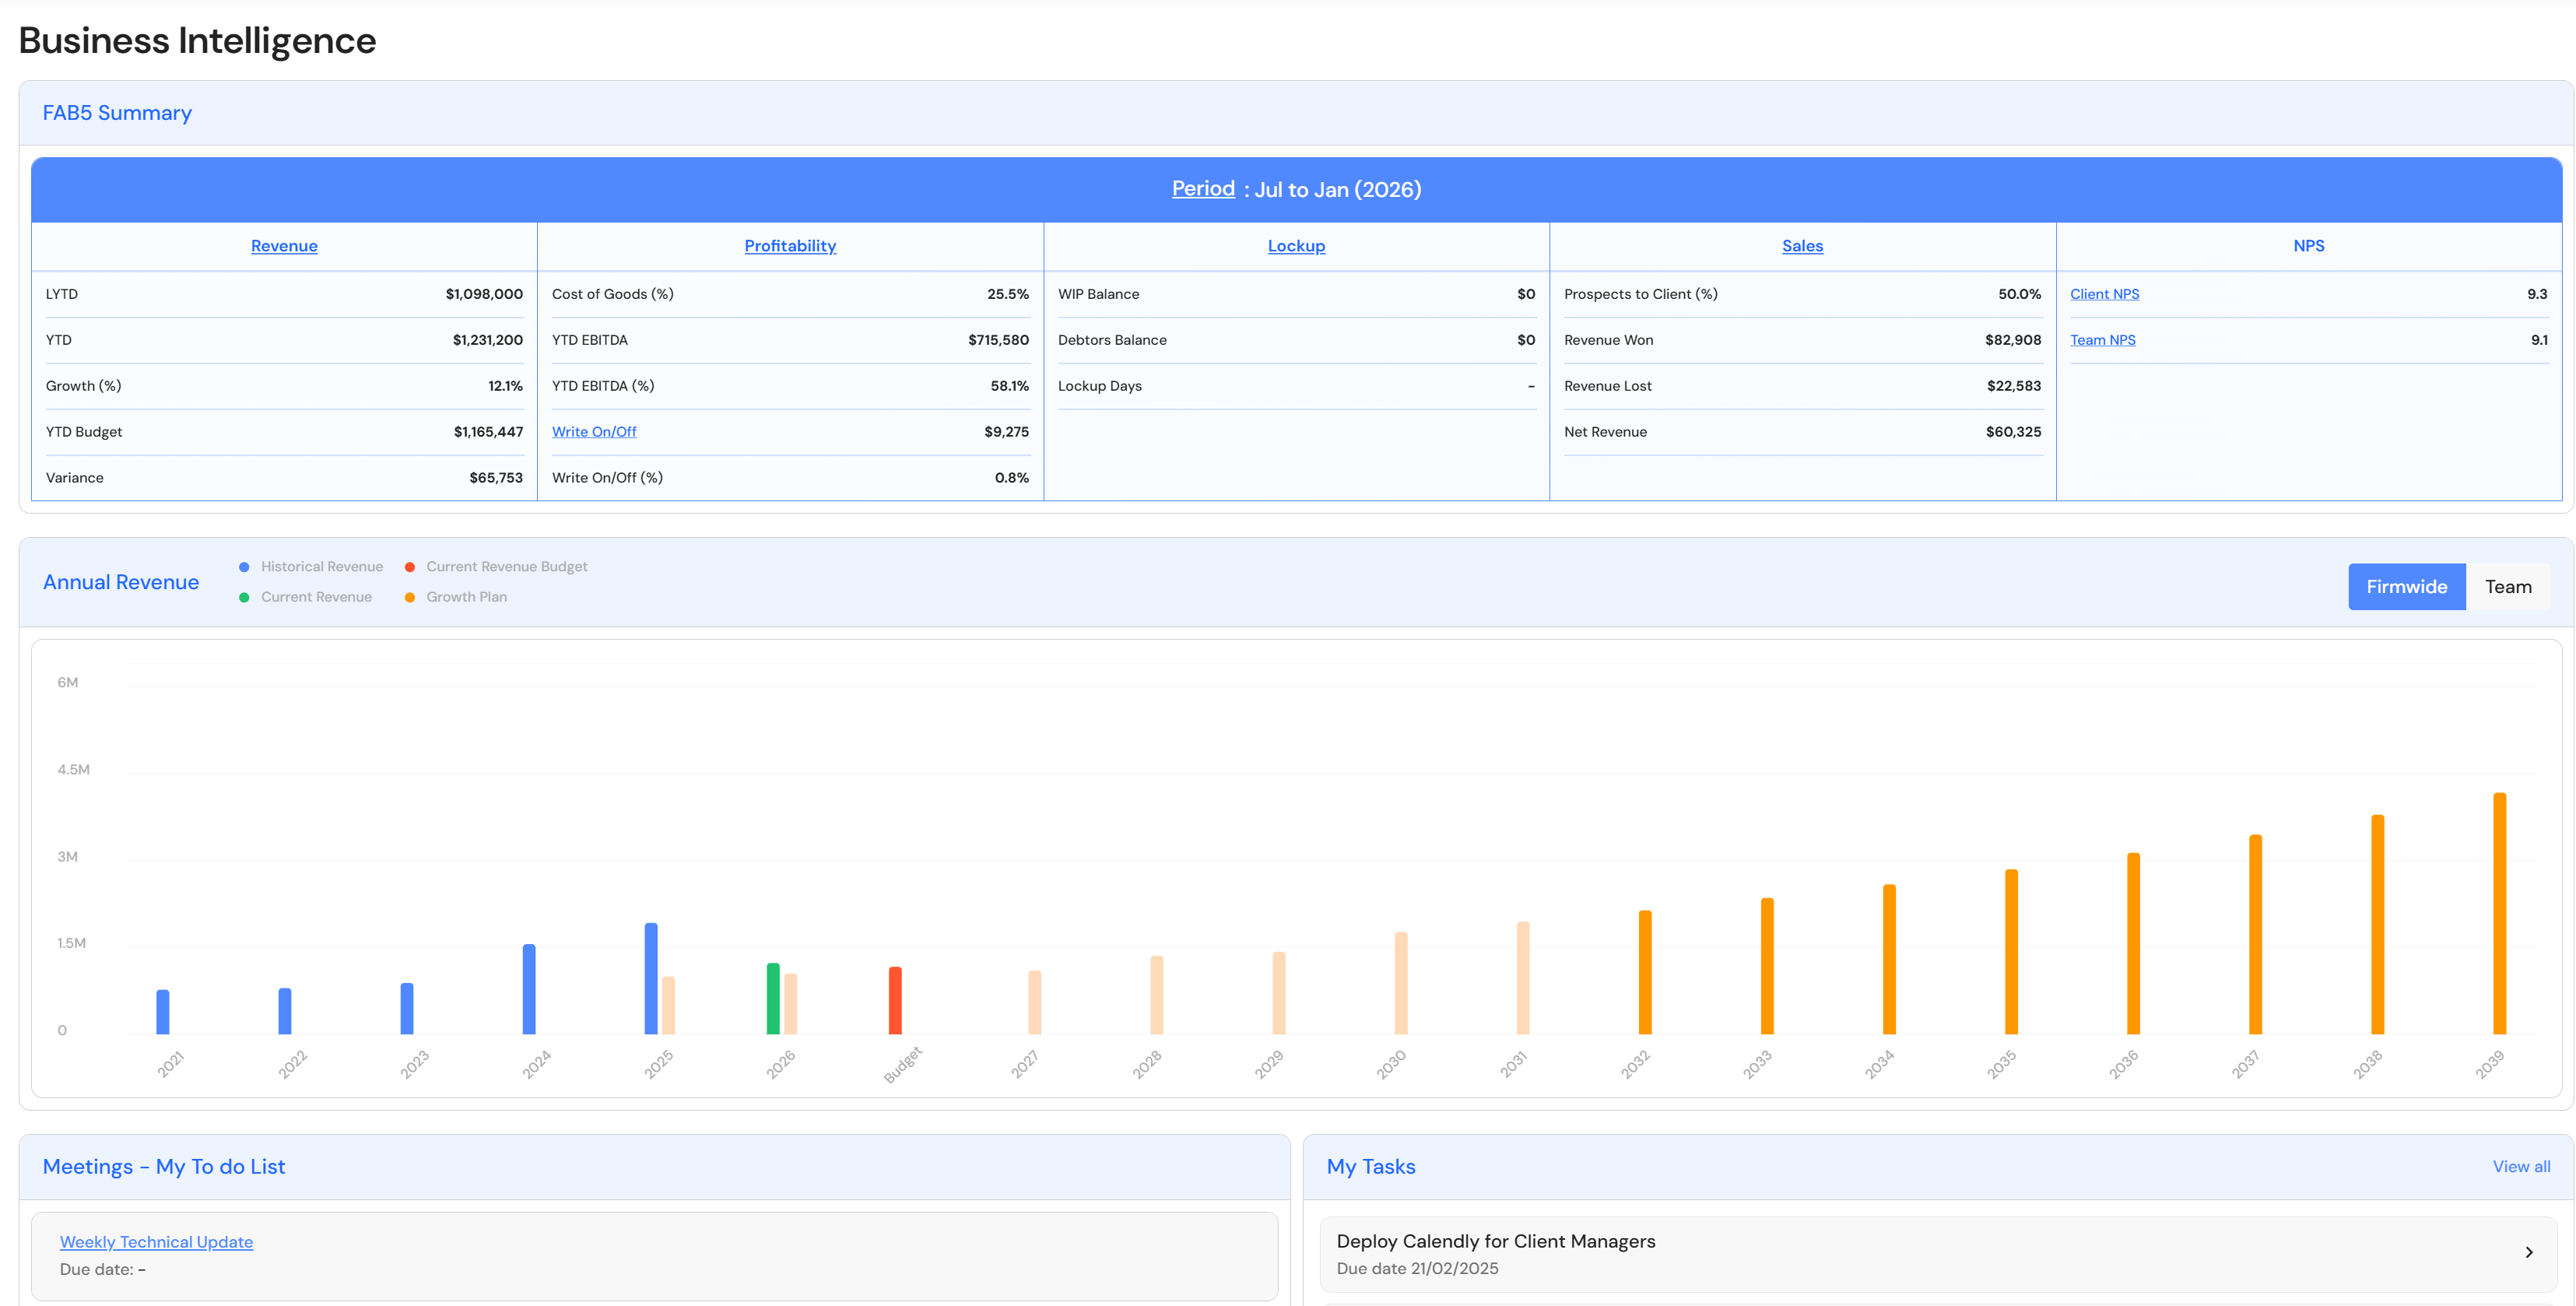
FAB5 Summary
The FAB5 Summary displays totals from each KPI in your default FAB5 dashboard.
The default FAB5 dashboard is defined by the newest active Budget & Capacity plan. This means, if you have two active Budget & Capacity plans in the same financial year, the FAB5 dashboard associated with the newest Budget & Capacity plan will be displayed by default.
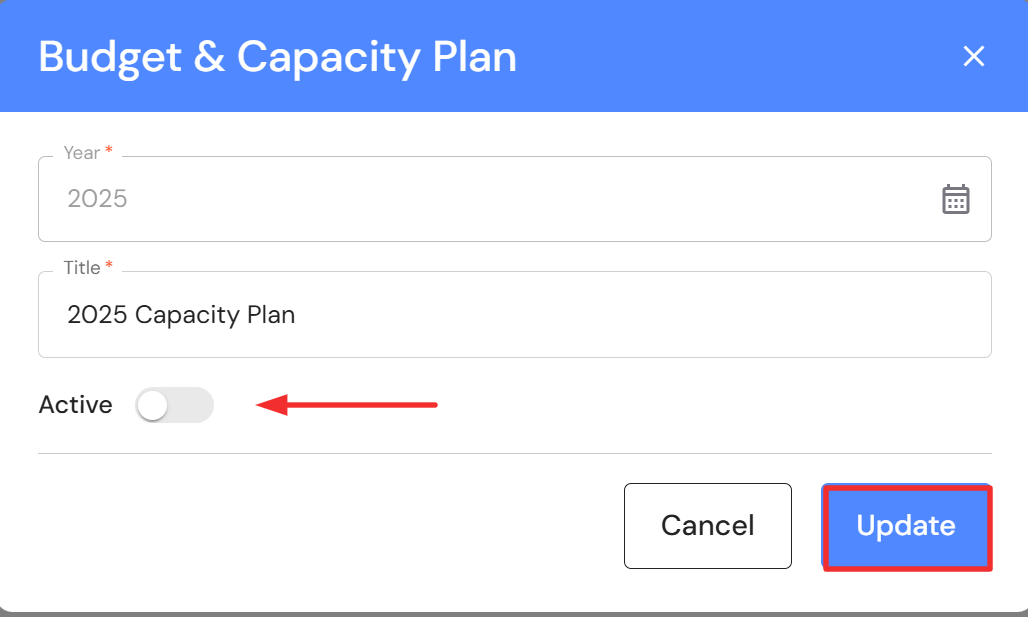
If you are seeing the wrong FAB5 dashboard, you will need to turn the status toggle to off on the relevant Budget & Capacity plan.
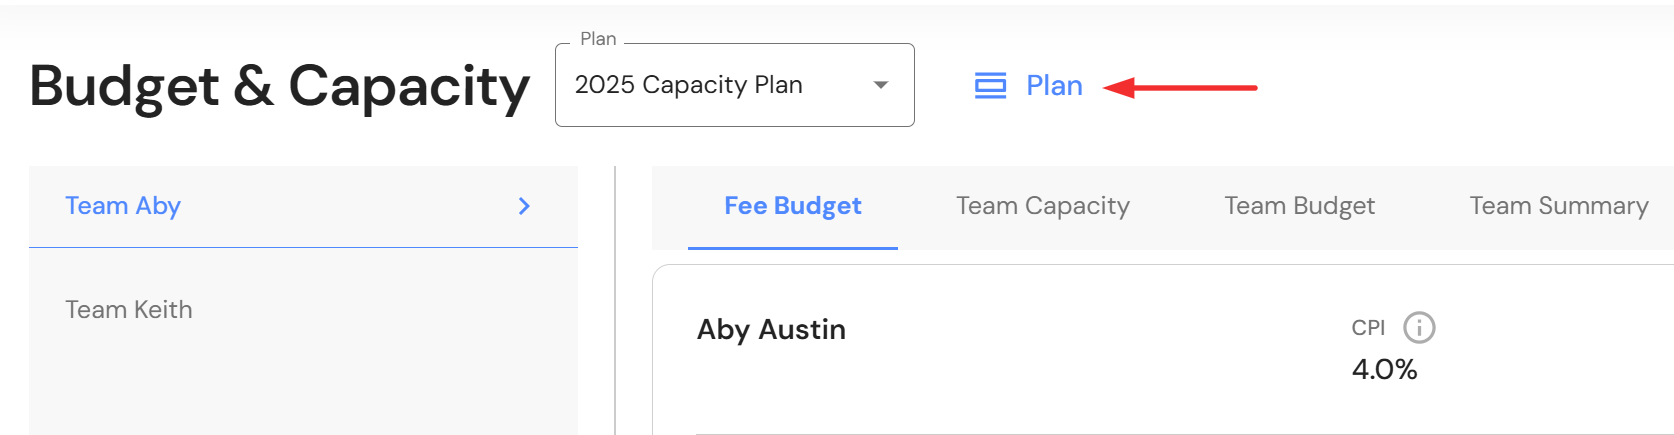
Go to Plan > Budget & Capacity
- Click on Plan
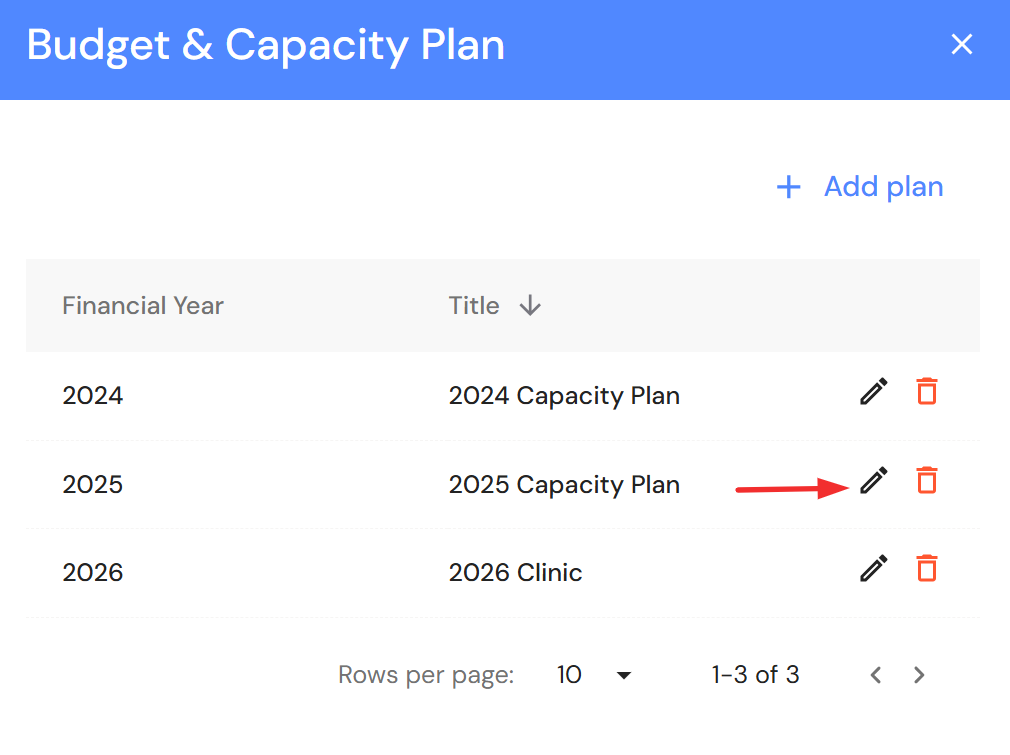
- Click on the pencil icon to edit the plan details
- Switch the Active toggle to off
- Click on update
Annual Revenue
History
The History tab displays your business's revenue history, year to date (YTD) reveue billed and the current year budget. The data comes from two locations using the following hierarchy:
- If there is a Budget & Capacity plan for any financial year, the graph will always look for revenue data from the linked Revenue plan. Remember, a Revenue plan is always linked to a Budget & Capacity plan. If you have created a Budget & Capacity plan for a financial year but you did not create a Revenue plan, no revenue data will be reported. The Annual Revenue graph will always look for a linked Revenue plan when a Budget & Capacity plan exists.
- If there is no Budget & Capacity plan for a financial year, the graph will point to Scorecards and report revenue history from the Growth Scorecard.
Forecast
The Forecast tab displays your projected revenue growth derived from the Growth Plan. If the graph is empty, go to Plan > Growth Plan and create your business's growth projection.
Annual Revenue by Team
The Annual Revenue by Team will display the annual budget from the newest active Budget & Capacity plan. The revenue history per team is derived from current the Revenue plan. We are working to include historical data in the chart.
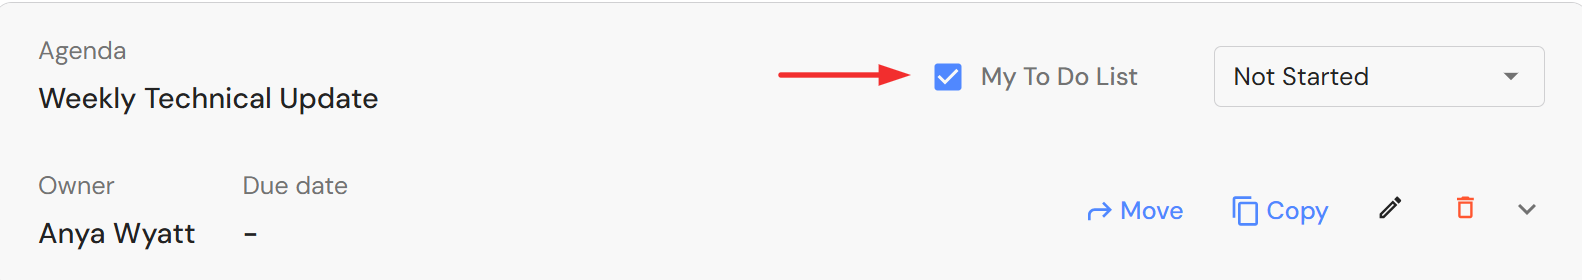
Meetings - My To Do List
In the Meetings module, you can add your agenda items to your dashboard. If you are the owner of specific meeting agenda items, click on the 'My To Do List' checkbox on each agenda and they will appear on your dashboard.
My Tasks
Your tasks from the Task Management module will be displayed here. The dashboard will only show tasks with an upcoming due date, not tasks with a past due date or no due date.
Upcoming Meetings
If you are an owner or attendee of a meeting in the Meetings module, your upcoming meetings will be displayed in the dashboard. The dashboard will not show meetings with a past meeting date or no meeting date.
My Delegation Progress
Divisions & Quads
The Divisions and Quads charts highlight where your time is dedicated in your business. It is a helpful reflection as you consider what needs to be delegated and where your time and focus should be directed to achieve your goals and the vision for your business.
Org Chart Progress
The Org Chart Progress graph highlights the percentage of your time spent across each division in your business.
My Improvement Progress
The charts from your active Scorecards are displayed here as a reminder of your current state of play. It helps you maintain the focus needed to achieve your desired balance in your personal and professional life.